







To learn how to fix a memory leak, first prove that memory keeps growing under a repeatable workload and does not return when the work ends. High RAM use by itself is not proof. Windows uses available memory for caching, and an application may legitimately hold a large project. Record a baseline, repeat one action, watch the same process, and change one variable at a time. The fix then belongs to the application, extension, service, or driver that fails to release resources.
Does memory rise once, or climb every time?
Restart Windows to establish a clean baseline, then wait until startup activity settles. Press Ctrl + Shift + Esc to open Task Manager. On Processes, sort by Memory and record total memory use plus the leading process. For better evidence, open Details, right-click a column heading, choose Select columns, and add Commit size, Handles, USER objects, and GDI objects where available.
Repeat the action that seems to trigger the problem: open and close the same document, visit the same browser workflow, start and stop a game level, or run the same import. Record the process values after each cycle and again after several idle minutes. A leak hypothesis becomes stronger when the same counter grows in a stair-step pattern and does not return near baseline after the work is closed.
| Pattern | Likely interpretation | Next test |
|---|---|---|
| Memory rises, then falls after the task ends | Normal working set or cache behavior is plausible | Repeat and confirm the plateau |
| One process grows after every identical cycle | User-mode application or extension leak is plausible | Run the same cycle with add-ons disabled |
| Browser total grows while one tab or extension dominates | Page, renderer, or extension issue | Test a clean profile or private window |
| Nonpaged pool grows while apps look stable | Kernel driver or component leak is plausible | Correlate with a device/driver change and expert tools |
| Memory stays high but performance is normal | Caching or retained project data may be intentional | Close the workload and observe reclamation |
| Disk usage grows, not RAM | Temporary files or logs, not a memory leak | Inspect storage separately |
Microsoft’s official memory-leak guidance likewise begins by determining whether a leak exists and then separates user-mode from kernel-mode sources. Do not download a “RAM cleaner”; forcing cached pages out can make the number look smaller without correcting the allocation bug.
How do you isolate an application or browser leak?
Save work, close the suspected application normally, and see whether its process exits. If it remains in Task Manager, wait briefly for legitimate background saving or synchronization. End Task only after you understand the risk of unsaved content. Reopen the application with the smallest possible project and repeat the test. A leak that occurs only in one project may come from a document, plug-in, or linked asset rather than the base program.
For a browser, use its built-in task manager where available to compare tabs, extensions, service workers, and GPU processes. Test the same pages in a private window with extensions disabled. Then enable extensions one at a time. Success is not a single low reading; the same browsing cycle must stop producing unbounded growth.
Update the implicated application or extension from its official source and read the release notes when they mention memory, rendering, or stability. If growth began immediately after an update, a vendor-supported rollback or clean profile can be a valid comparison. Do not install an old executable from an unverified archive.
When does a service or driver become the suspect?
If no user application accounts for increasing committed memory, check whether the pattern began after a driver, security product, VPN, virtual machine, storage filter, or device installation. Use a clean boot only as a controlled diagnostic: disable non-Microsoft services through System Configuration, restart, repeat the workload, and restore groups systematically. A clean boot that hides the symptom narrows the source but is not the final configuration.
Kernel pool analysis is advanced. Performance Monitor, PoolMon, Windows Performance Recorder, or a dump may be appropriate for an administrator or developer who can interpret tags and stacks. Driver Verifier can deliberately stress drivers and trigger crashes; do not enable broad settings on a production PC without a recovery plan. Use the hardware manufacturer’s supported update or rollback once evidence identifies the device.
A memory leak causes slowdown or crashes, while an abrupt loss of electrical power is a different fault. If the computer turns off rather than merely exhausting memory, use the random-shutdown checks instead.
Which fixes address the cause rather than the symptom?
For a confirmed application leak, preserve documents, install the vendor’s corrective update, remove the failing extension, reset only the relevant profile, or use a supported previous release while reporting the reproducible steps. For a service, correct its configuration or update the package that installed it. And for a driver, use the device or PC manufacturer’s known-good package and verify that Device Manager shows the intended version.
Adding RAM can delay resource exhaustion but cannot make leaked allocations return. Increasing the page file may prevent an immediate out-of-memory failure, yet the faulty process can continue growing. Restarting clears the accumulated allocation and is useful for recovery, not proof of repair.
Check whether “memory” is being used to mean storage. A folder full of caches, logs, or temporary files consumes disk capacity, not RAM. Review what temporary files are before clearing application state that may contain unsaved work.
What should you do if a crash caused actual file loss?
First use the affected application’s own recovery path. Reopen the program once, inspect AutoRecover, drafts, recent files, version history, cloud history, and application-specific backup folders. For example, a spreadsheet that stopped responding may still have an AutoRecover or versioned copy; the Excel not-responding workflow explains that decision. Data recovery is not required merely because a process used too much RAM.
If a local file was deleted, replaced, or no longer accessible after the crash and no valid backup exists, Drecov can search stable Windows storage for the missing file. It does not repair RAM, release leaked allocations, debug an application, or reconstruct unsaved content that was never written to disk. Stop writing to the affected volume so new caches, crash dumps, or updates do not overwrite recoverable data.
⚠ Warning: Install it on a drive different from the one where your data was lost to prevent overwriting.
Step 1: Open Drecov and select the file’s original location
Prepare another healthy drive for recovered output. Do not install Drecov on the partition that held the missing file. Open it and select the original volume, such as the Windows partition that contained Desktop or Documents, or a stable external work drive. If the storage device disconnects, changes capacity, stalls reads, or makes unusual noises, stop scanning and move to imaging or professional recovery.
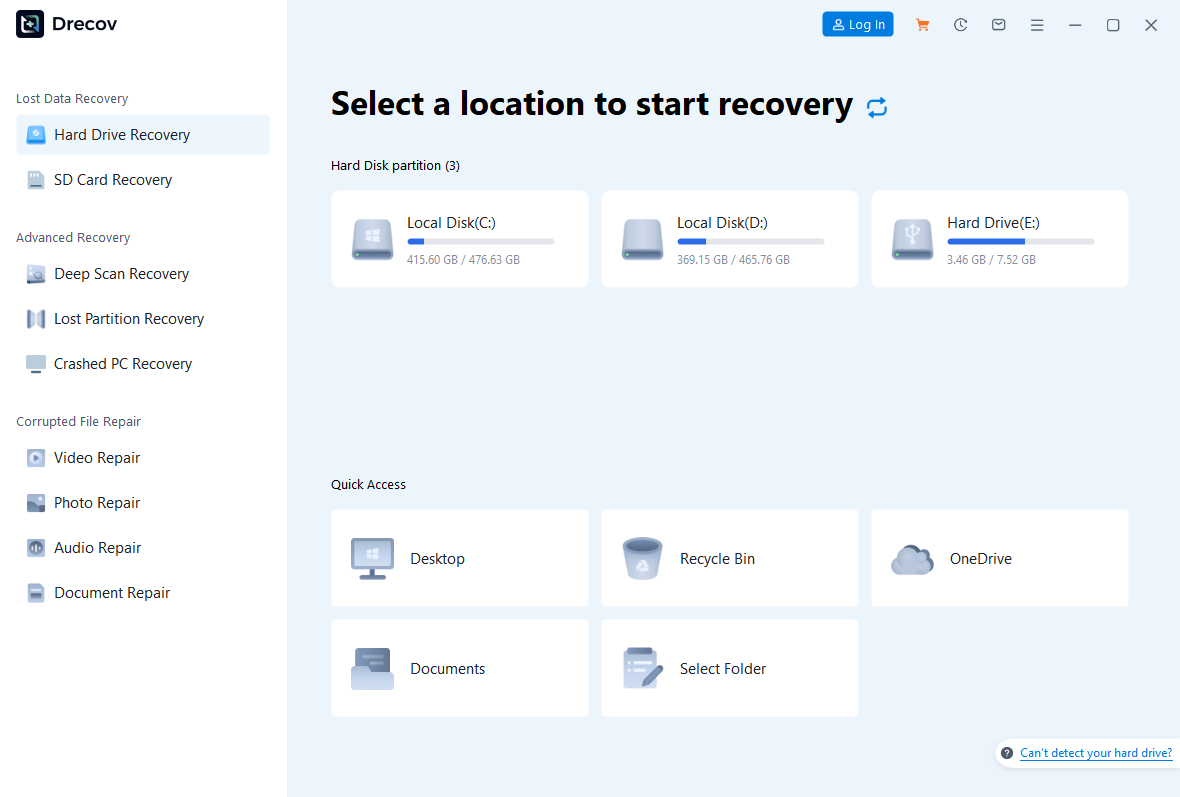
Step 2: Run Quick Scan, then Deep Scan if the source stays stable
Start Quick Scan and inspect the former project folder. If the required item is missing and the device remains responsive, continue with Deep Scan. Look for application backup extensions and earlier complete copies as well as the expected filename. Do not keep rescanning an unstable source.
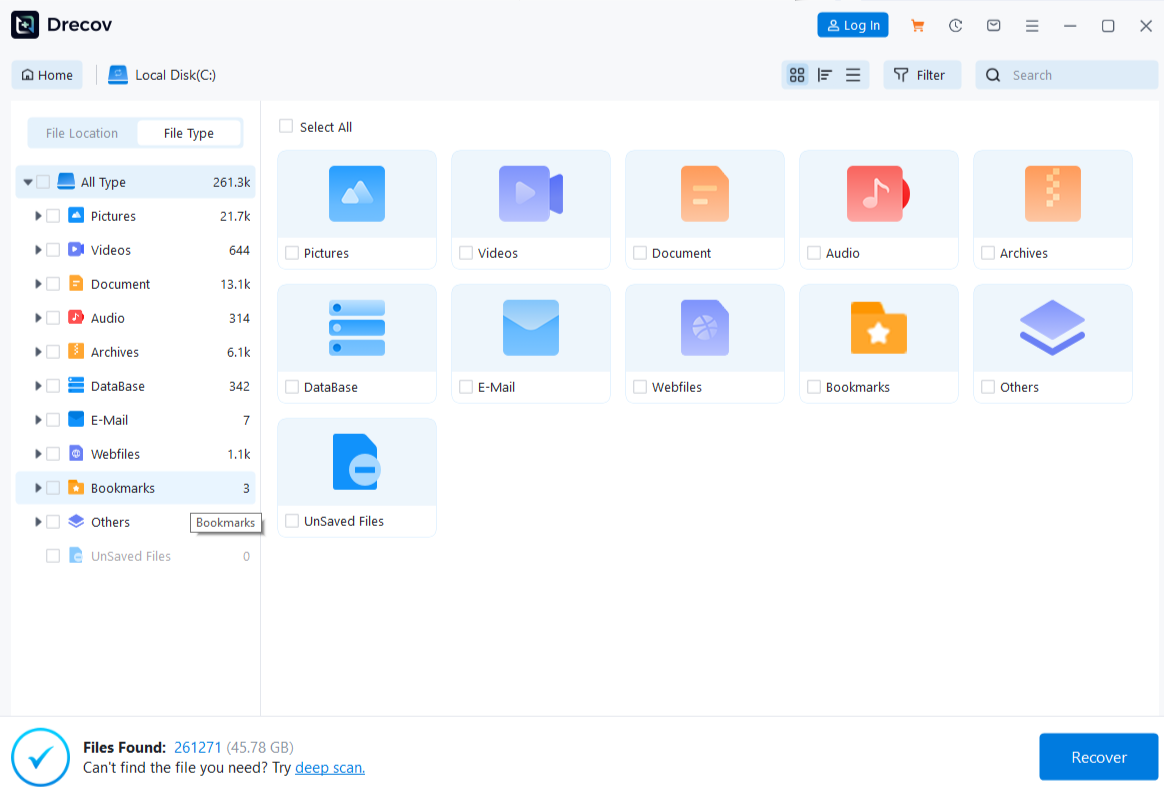
Step 3: Filter and preview plausible versions
Filter by filename, former path, date, and file type. Preview several supported candidates. A readable preview does not prove that every page, layer, worksheet, video frame, database record, or linked asset is complete. Recover multiple plausible timestamps if the crash occurred during a save.
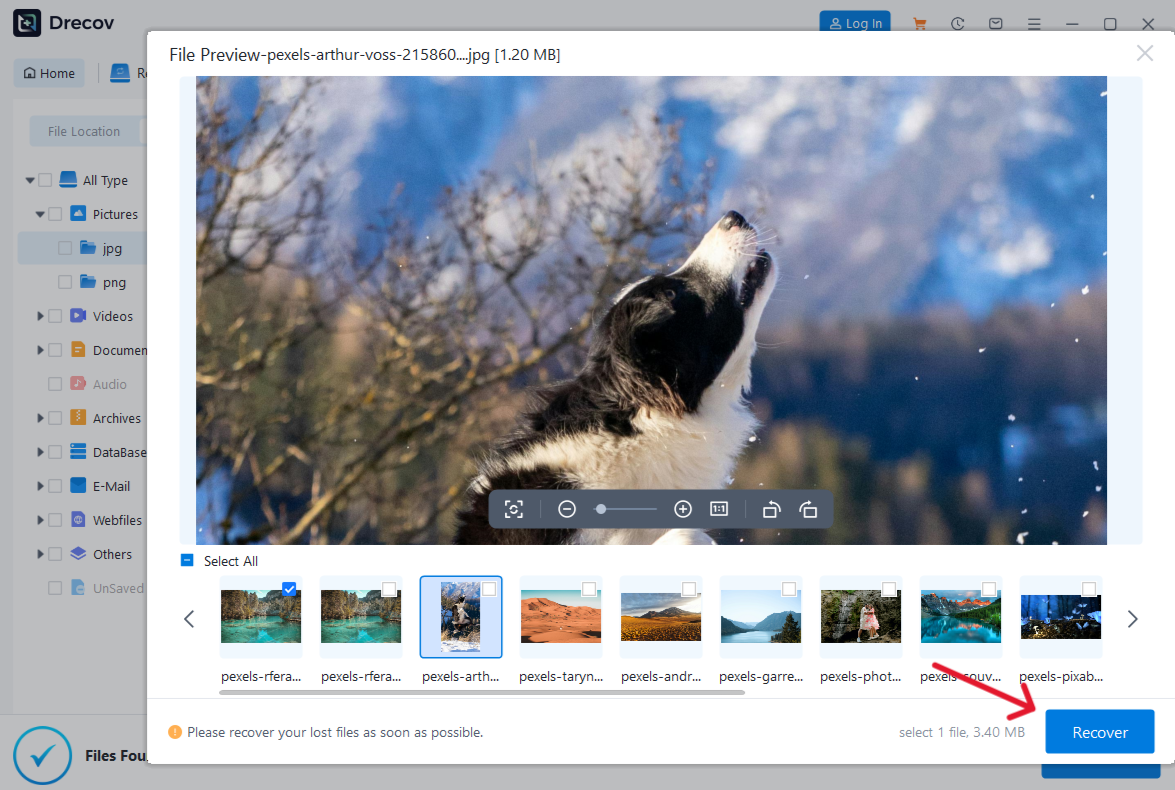
Step 4: Recover elsewhere and validate in the original application
Save candidates to the separate healthy drive, never to the source. When the chosen destination seems empty, open it and look for output inside a Drecov Folder or Recovery Folder. Open copies in the appropriate application, check their full structure, and save a new verified version. Only then resume updates, profile resets, or other troubleshooting that writes to the original volume.
⚠ Warning: Install it on a drive different from the one where your data was lost to prevent overwriting.
How do you prove the memory leak is fixed?
Repeat the same workload, sample interval, and number of cycles used for the baseline. Compare Commit size, handles, relevant pool counters, and application behavior. Normal memory use can fluctuate, so look for a stable plateau rather than identical numbers. Close the workload and confirm that resources return to an expected range.
Run the test long enough to cover the original failure window, but protect work and avoid deliberately crashing a production system. Reboot once and repeat a shorter confirmation. Keep the notes with application and driver versions so a future regression can be compared accurately.
If the process still grows, revert only the last controlled change and continue isolating. A different process becoming largest does not necessarily mean the leak moved; sorting by current working set can reorder normal consumers. Use consistent counters and the same scenario.
Questions about Windows memory leaks
Is 80 percent RAM use a memory leak?
Not by itself. The workload, commit limit, caching, and whether memory returns all matter. A repeatable upward trend without release is stronger evidence than one percentage.
Can Task Manager identify the exact faulty function?
It can identify suspicious processes and counters, but source-level diagnosis may require VMMap, Performance Monitor, Windows Performance Recorder, dumps, symbols, or vendor debugging.
Does clearing standby memory fix a leak?
No. It may free cached pages and change displayed use temporarily. A leaking process or driver will continue allocating until its code, configuration, or lifecycle is corrected.
Can malware cause rising memory use?
Malicious software can consume resources, but memory growth alone is not proof. Use current Windows Security or the organization’s approved security process, and investigate the named process and signature rather than downloading an unknown cleaner.
Will Drecov recover unsaved work from RAM?
No. Drecov scans storage for file data. It cannot reconstruct content that existed only in volatile memory and was never written. Application AutoRecover, temporary files, or a prior saved copy must exist on storage to be found.
A useful memory-leak fix starts with a curve, not a guess. Reproduce the growth, isolate the responsible component, apply a supported correction, and rerun the same experiment until memory stabilizes. File recovery belongs only to a separate, verified loss caused by the crash.
⚠ Warning: Install it on a drive different from the one where your data was lost to prevent overwriting.